Assignment: Mountain Paths
Searching out paths through 2-dimensional data
Original assignment by Baker Franke, University of Chicago Laboratory Schools
The Problem
There are many contexts in which you want to know the most efficient way to travel over land. In this assignment, you will read in topographic (land elevation) data and compute good paths through the mountains. You will use glib to visualize the mountain region and your paths.
Grab the updated glib.py file here.
You will submit through blackboard:
- One code file, containing both parts
- A text file with a brief (couple paragraphs) write-up explaining how you approached the problem, obstacles you hit, and citing any resources (books, online, people) that you used while working on this assignment.
Turning in code that runs counts for 50 points. The write-up counts for 25 points. Readable code (variable and function names, reasonable whitespace, docstrings) counts for 25 points.
Part I. Visualize the Mountain (200 pts)
Your first job is to vizualize the land described in the topographic data files, like so:
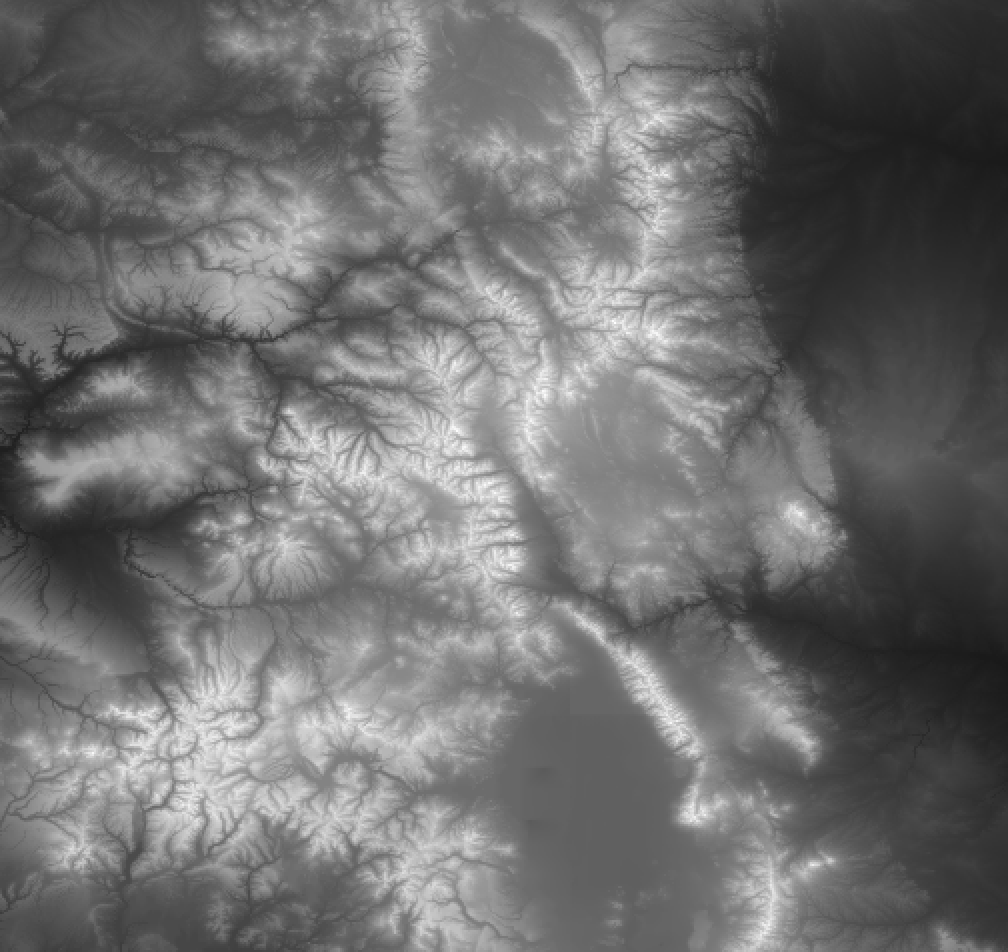
There are two data files for you to test your code on. Each contains the elevation numbers, separated by spaces, with all the numbers for each row on the same line.
- Colorado_480x480.txt: width 480, height 480
- Colorado_844x480.txt: width 844, height 480
To vizualize a file, you need to:
- Write a function called
read_filethat takes a topographical file filename and returns a list-of-lists containing the data in that file. For example, if there were 100 lines in the file and each had 200 values, then your function should return a list of 100 lists, each of which has 200 values. Since we want this function to work with any of the topological data files, you won't be hardcoding the number of lines or values in your code. That means you have to use an indefinite loop. - Write a function called
normalizethat takes the list-of-lists of topographical data and scales it so that the lowest value is 0 and the highest is 255. Scaling, if you haven't done it, is just like converting numbers to percentages (e.g. 3 points on a 5 point test is 60 percent). But instead of scaling to 0-100, you want 0-255. This will require figuring out the lowest and highest values in the list-of-lists. Your function can either change the values in the list-of-lists or create a new list-of-lists. - Write a function called
displaythat takes the list-of-lists fromnomalizeand usesglibto create a new image (of the correct width and height), set the pixels of that image to reflect a grayscale image of the elevation data, and return the image object. Hints:- The updated
glibhas a newcreate_imagefunction to create an initially blank image of a certain size. - The example we did in class of getting access to the pixels in any image is up on the module page
- To set gray values, just set all three pixel channels (R, G and B) to the same value. (0,0,0) is black, while (255,255,255) is white.
- The updated
- Finally, write a
mainfunction that reads in a topological data file, normalizes the data and displays it as an image, using your functions.
Part II. Greedy Paths (200 pts)
Continue working in the same code file.
In this part, you will find paths that minimize the total elevation change with each step. That is, the sum of the absolute value of the change in elevation for every step.
To define the problem clearly, we have the following simplifications and definitions:- We're working on a grid (discretized data)
- Assume you can start at any point on the left side of the region
- Assume you can end at any point on the right side of the region
- Assume you can move up/down, left/right and diagonally
- The goal is to find the path with the least total elevation change - the sum of the amounts you step either up or down with each step along the way.
As we discussed in class, finding the absolute best path through the mountains can be very time-consuming and difficult. Instead, we want to come up with a reasonable approximation. Several of you came up with ideas that are close to a common approximate solution, the greedy approach. A greedy algorithm is one in which, in the face of too many possible choices, you make a choice that seems best at that moment. For this problem, the simple greedy approach is just to choose the next step with the smallest elevation change.
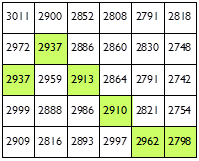
To further simplify, assume that you can only move right, diagonally up-right or diagonally down-right. This eliminates any backtracking. Here is an example of a greedy walk (path in green) through the topological data in the list-of-lists.
To complete this part:
- Write a function
greedy_walkthat takes the list-of-lists, a starting row, the image object displaying the map and a color triple (e.g. (255,100,100)). Your function should perform a greedy walk starting from the left most point of the specified row. For each step in the walk, make that pixel in the image the specified color. Your function should return the cumulative elevation changes in that walk. - In your
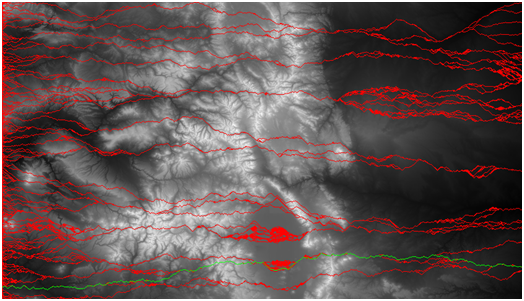
mainfunction, call yourgreedy_walkfunction for all rows, showing the paths in red. Keep track of the row with the smallest cumulative elevation change and re-callgreedy_walkto show it in green. The result should look something like:
Extra Credit: Beat the Greed (100 pts)
Include a write-up describing a better algorithm you could use than greedy.
- Explain the idea and why it would give a better result
- Provide pseudo-code (English) steps for the algorithm
- Explain how much work you think this alternate algorithm would be, compared to greedy
- Explain how you would test is to see how good it really is