Abstract
We design a Lyapunov based boundary feedback controller for achieving mixing in a 3D pipe flow governed by Navier-Stokes equations. We show that the control law maximizes a measure of mixing that incorporates stretching and folding of material elements, while at the same time minimizing the control effort and the sensing effort. The penalty on sensing results in a static output-feedback control law (rather than full-state feedback). We also derive a lower bound on the gain from the control effort to the mixing measure. Furthermore, we establish input/output-to-state-stability properties for the the open-loop system. These results show a form of detectability of mixing in the interior of the pipe from the chosen outputs on the wall. The effectiveness of the optimal control in achieving mixing enhancement is demonstrated in numerical simulations.
Sensing and Actuation
The geometry of the pipe flow described in the next pricture.
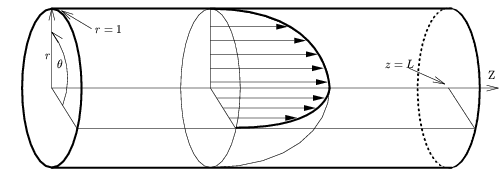 |
| Geometry of the pipe flow. |
Our boundary feedback control is written as
 |
The actuated fluid velocity at the wall is restricted to be normal to the wall. The measurement available is the pressure drop from any point on the pipe wall to the opposite point. This control law ensures a zero net mass flux across the pipe wall, and therefore it is a natural condition to impose from a mass balance point of view.
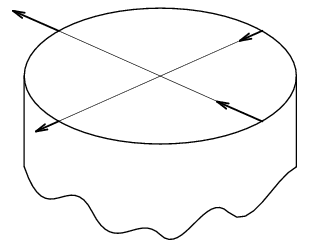 |
| Actuation |
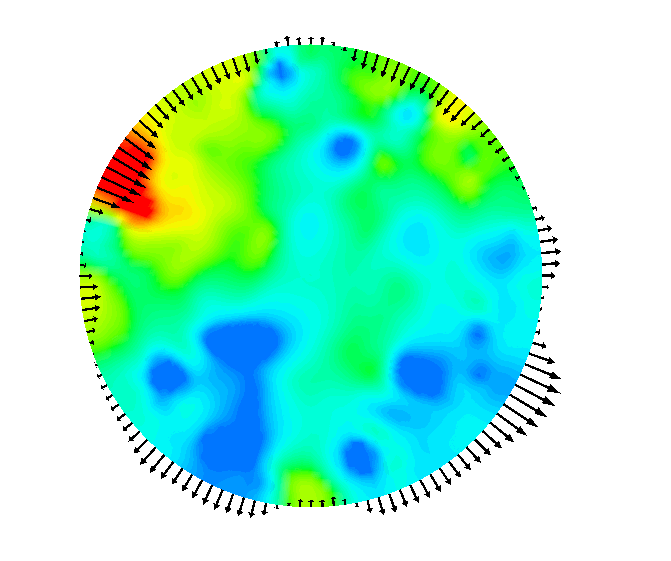
The followin picture shows the instantaneous pressure field with controlled velocity (magnified) in a cross section of the pipe. The control ``blows in'' when wall pressure is high and ``sucks out'' when wall pressure is low. Spatial changes in the control velocity are smooth and small, promising that low number of actuators will suffice in practice.
Measuring Mixing
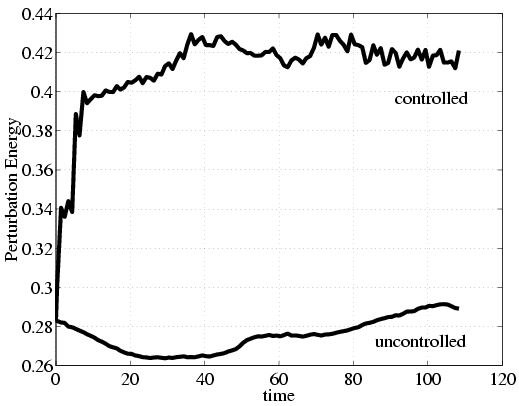
The next figures show that our control results in an approximately 50% increase in the perturbation energy and 92% almost instantaneous increase in the enstrophy. While comparison based on perturbation energy is important as it is the part of the cost functional, enstrophy provides us with a measurement that is more closely related to mixing.
| Perturbation Energy | Enstrophy |
 |
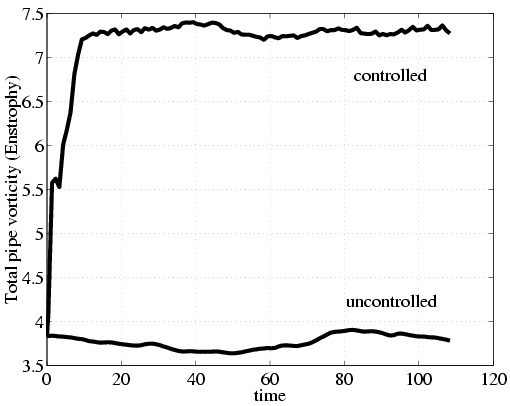 |
| Perturbation energy and Enstrophy. | |
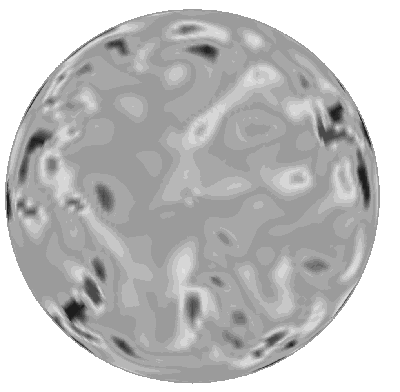
The instantaneous streamwise vorticity along a cross section of the pipe also shows some promise for increased mixing with higher values of vorticity and more complex vortex structures in the controlled case than in the uncontrolled case. Vorticity is increased not only near the wall but everywhere in the pipe.
| Uncontrolled | Controlled | |
 |
 |
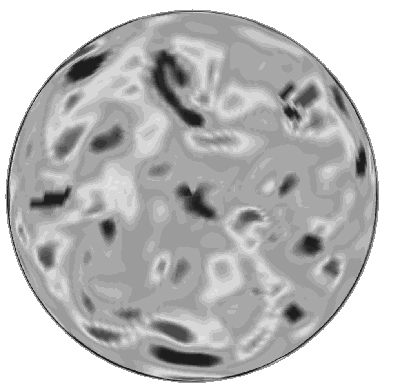 |
| Streamwise vorticity | ||
The method we use to quantify and visualize mixing is the tracking of dye in the flow. We consider the problem of mixing of a single fluid (or similar fluids) governed by the stretching and folding of material elements. We introduce passive tracer dye along the center of the pipe represented by a set of 100 particles.
 |
| Initial particle distribution. |
We trace the position of these particles using a particle-line method. The distance between neighboring particles is kept under 0.1 by introducing new particles to halve the distance if necessary to obtain a connected dye surface at all time. As shown below, the number of particles, that is, the length of the dye, increases in the controlled case at a much higher rate than in the uncontrolled case.
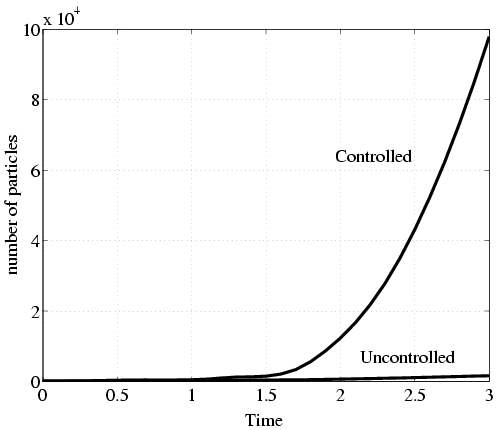 |
| Length of dye as a function of time. |
Adding particles is not feasible computationally for an extended period of time. We stopped adding particles when their number reached two million (t=4 in the controlled case and t=8 in the uncontrolled case), but we continued tracing them. The next pictures and animations show the distribution of particles inside the pipe. In the controlled case we obtain more uniform particle distribution even for smaller time.
Actuator Distribution and Bandwidth
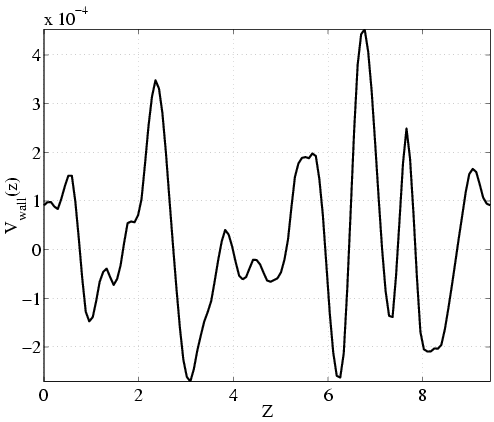
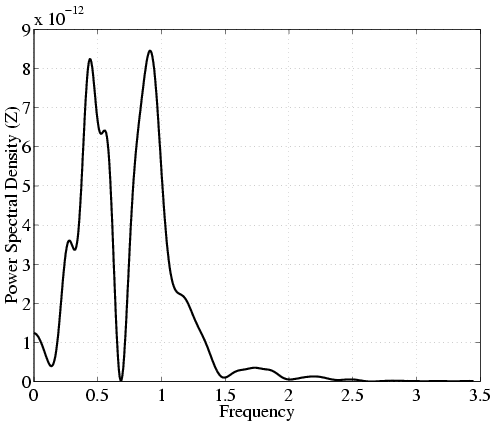
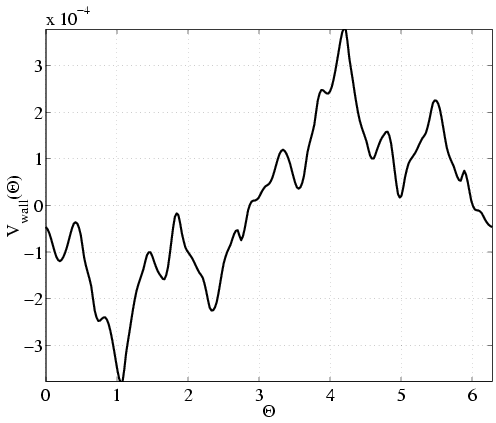
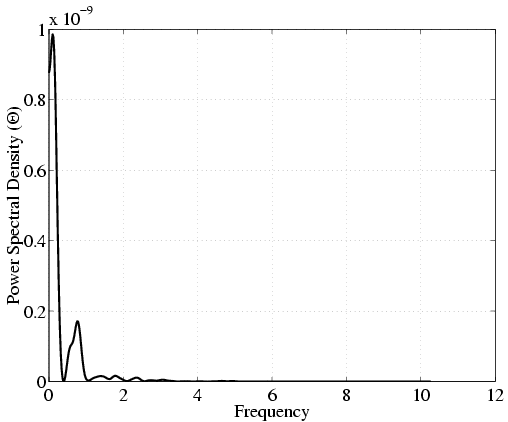
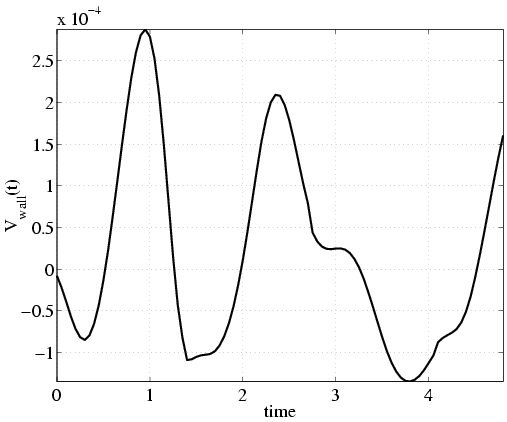
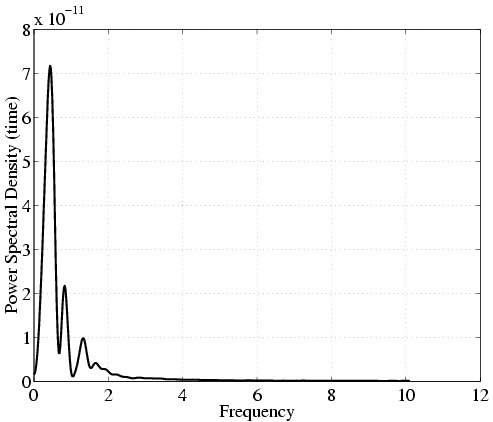
In order to investigate the density and bandwidth of sensors and actuators needed we calculate the power spectral densities of the control. The spectral plots alongside with the original signals are shown in the next figures. Only about 10-15 actuators/sensors are needed along the pipe length. Similarly, in the angular direction we need at most 15-20 actuators/sensors. That results in approximately 200 micro-actuators/sensors for the whole pipe surface. The time-frequency analysis shows a bandwidth required for sensing/actuation of only 1.5Hz.
| Spectral analysis of the control. | |
| Streamwise frequency | |
| Control signal | Power spectral density |
 |
 |
| Angular frequency | |
| Control signal | Power spectral density |
 |
 |
| Time frequency | |
| Control signal | Power spectral density |
 |
 |
